// descriptive statistics
Measures of Frequency
Measures of Frequency is the first and most basic kind of descriptive statistics that can be done on any dataset. Such statistics are usually performed during Univariate or Bivariate Analysis for describing categorical variables. Under measures of frequency, the analysis is done through counting the categories of a variable (i.e. by counting the number of times each category in the variable got repeated) and by calculating percentages from such counts.
The best way to understand all of this is by using an example and applying the concepts found under the Measures of Frequency.
For example, have a dataset with two variables: Country and State.
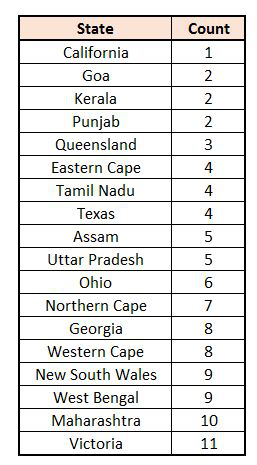
Frequency table
We can first count the frequency of the categories in a variable and create a frequency table. We first start off with the variable State (this is a univariate analysis as only one variable is involved).
On the basis of the frequency table, we can create various charts that can help us in describing our data.
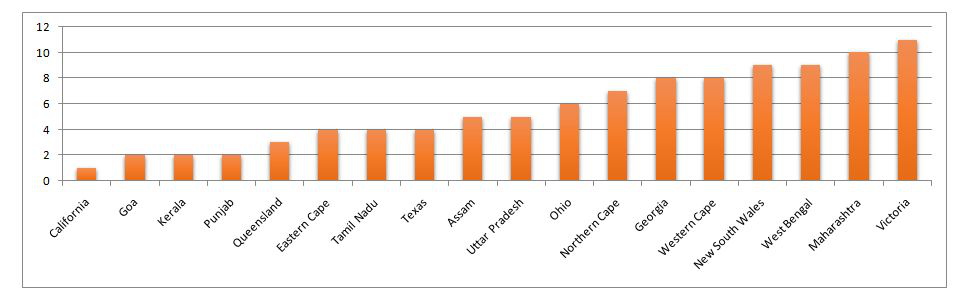
Bar graph
We can use bar graphs showing the frequency of each of the categories in the variable ‘State’.
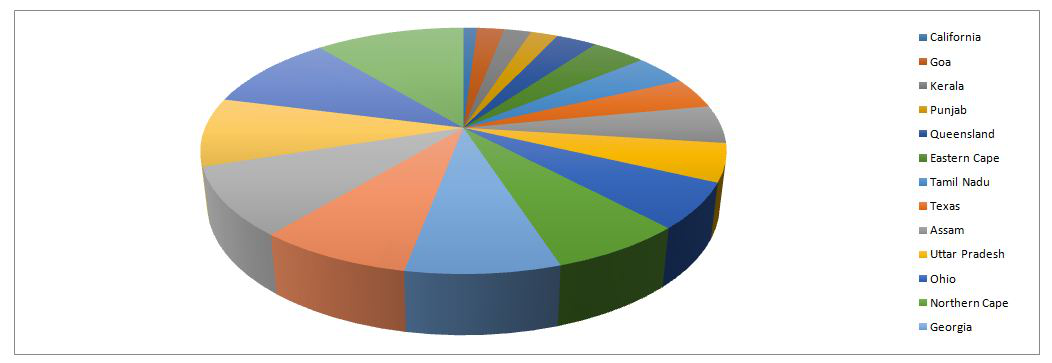
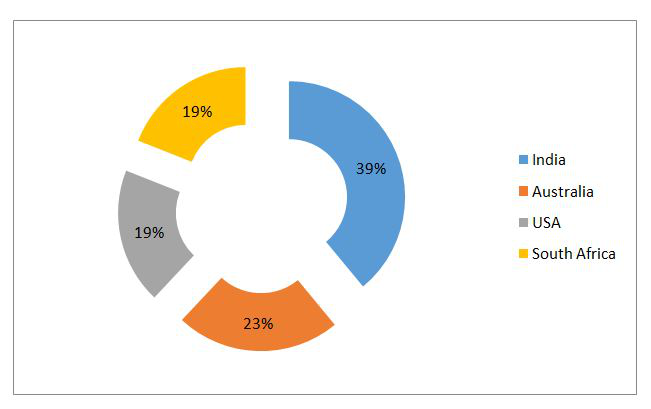
Pie chart
We can also use pie charts to describe the frequencies of various categories in this variable.
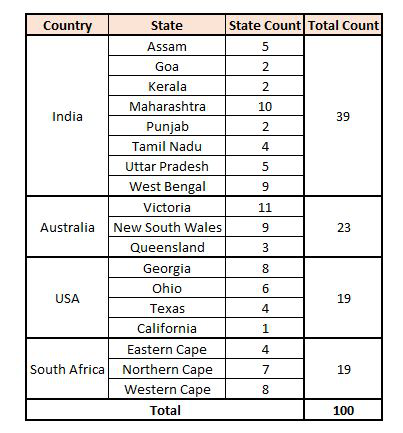
Cross frequency table
We can also analyze the frequency by creating a cross frequency table and analyze the frequencies of two variables (such an analysis is called Bivariate analysis, as two variables are involved in such an analysis).
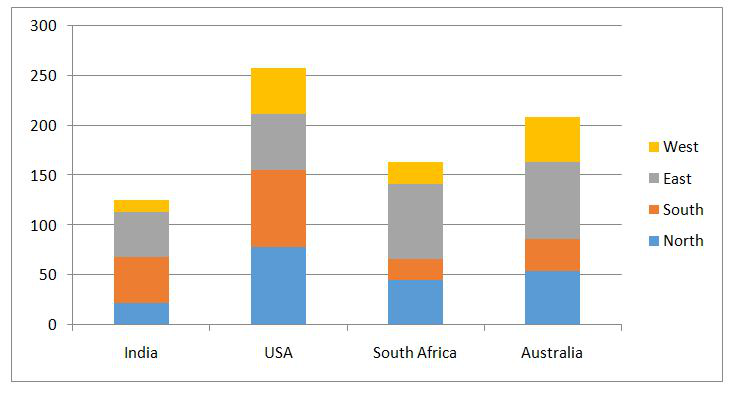
Stacked bar graph
Stacked bar graphs can also be created to visualize the relationship between two categorical variables.
Percentage chart
We can also use percentages to see the share of each category in a variable.
Thus we can see how the frequency of each category helps us in understanding the data. However, it is the most basic kind of descriptive statistics, and for further information, we require to use other kinds of statistics.