// theory · descriptive statistics
When it comes to statistical analyses, there are broadly two kinds of analysis we can perform: Descriptive Statistics and Inferential Statistics. In this section, the former is discussed.

Descriptive Statistics apply to the members of a sample or population to describe them in a nutshell, giving us information about the main features of the collected data. It is generally the first kind of analysis performed on a dataset. The most important aspect of Descriptive Statistics that makes it different from Inferential Statistics is that we don't draw any inferences from such an analysis and avoid reaching any premature conclusions about our data; we simply perform such an analysis to get to know the characteristics and basic qualities of the data. We often use charts, graphs, and other visualisation techniques along with summary tables to summarise our data for better and easier understanding.
There are 4 major types of Descriptive Statistics. The posts below explain each of these Descriptive Statistics.
Measures of Frequency provide us with the most basic kind of information, which is how often something occurs. This most basic kind of information helps us in forming very simple tables and graphs by using very simple arithmetic calculations such as count, percentage, etc. Thus, we get to know about the frequency of values in the data, which provides us with a frequency distribution, and when this distribution is plotted on a graph, it leads us to the concepts of Measures of Central Tendency.
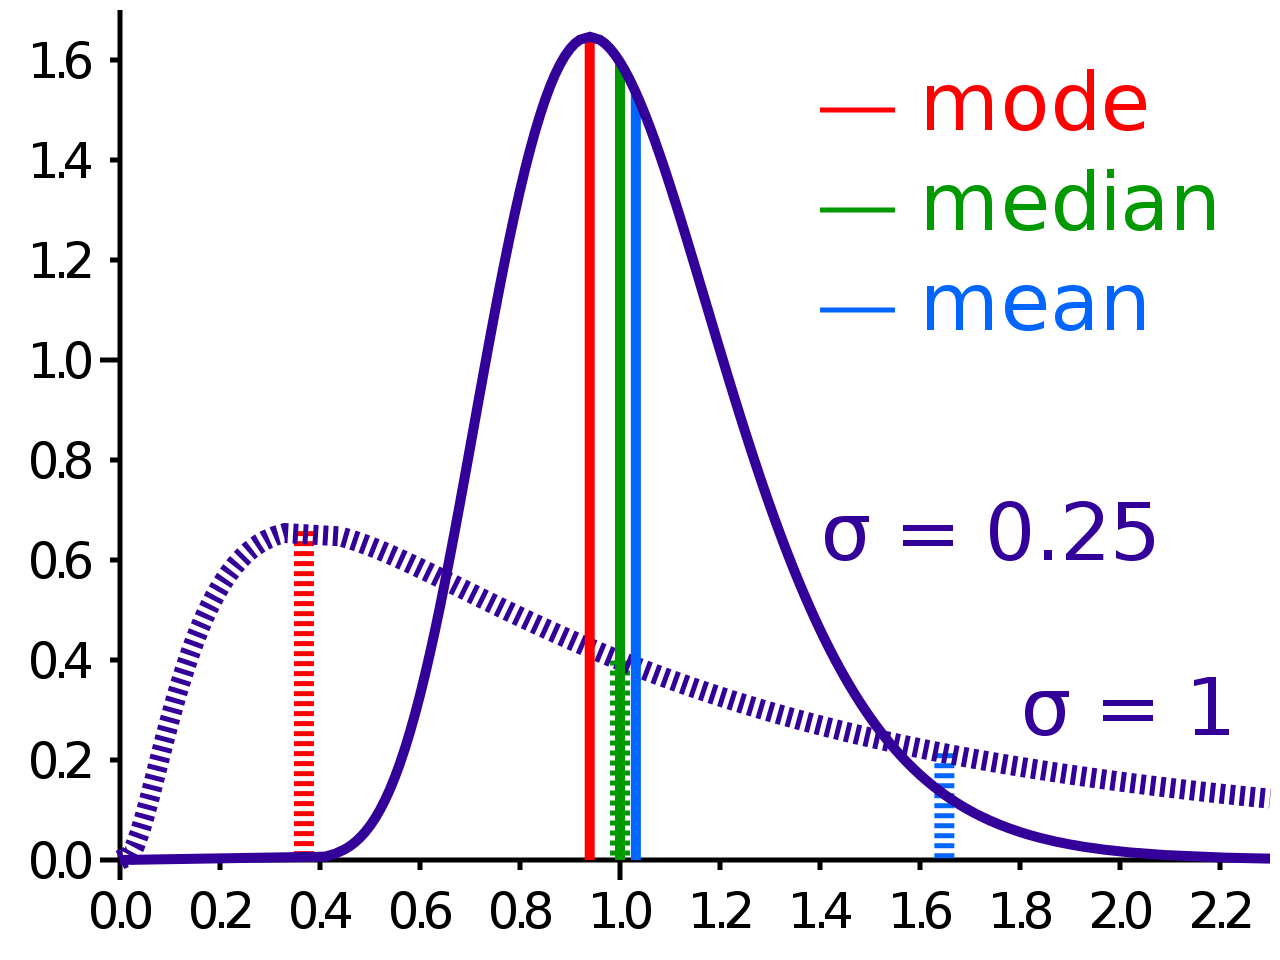
Measures of Central Tendency are the kind of descriptive statistics that allow us to describe our whole data with a single value. This value is generally the number that occupies the central position in the data set. This value can be calculated by Mean, Median, and Mode, which form the different Measures of Central Tendency, and each of these measures has its own importance and is used in different situations. Also, remember that Measures of Central Tendency are also known as Measures of Central Location.
These descriptive statistics help us in explaining the spread of the data. Different Measures of Variability are used to explain how the data is distributed. This distribution will later help us in understanding how Inferential Statistics are able to draw various conclusions about the population. The Measures of Variability are Range, Variance, Standard Deviation, etc., and these play an important role in almost all kinds of advanced statistics.
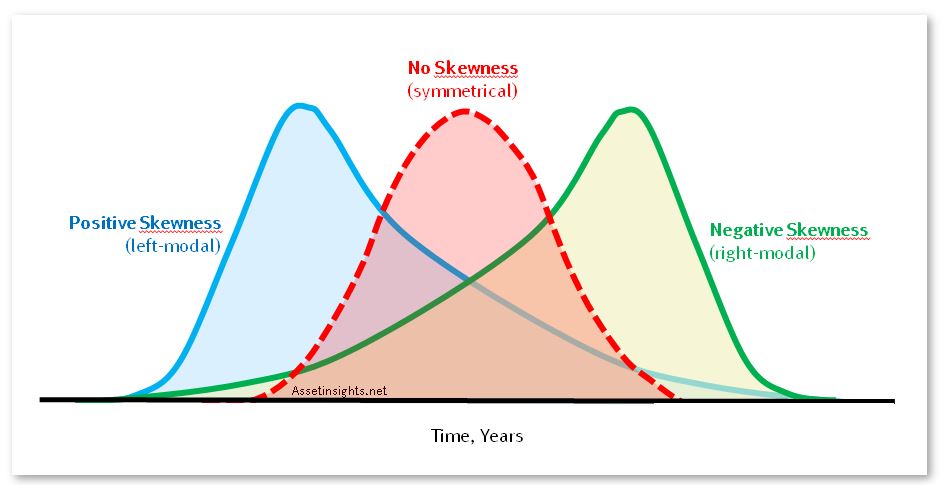
When the data is plotted on a graph, it takes a shape, and this shape helps us a lot in understanding the features of the dataset. Concepts understood in Measures of Central Tendency and Variability are used here. Here, our dataset is described in terms of the shape it has, and through this, we are able to describe the characteristics of our dataset.