// basic statistics · theory
Statistics can be divided into Descriptive Statistics and Inferential Statistics. In this section, the latter is discussed.
Descriptive Statistics describes the data; however, we refrain ourselves from reaching any major conclusion and just stick to merely describing the kind of data that we have. On the contrary, with Inferential Statistics we make conclusions and even go to the extent of making predictions. One of the biggest uses of Inferential Statistics is that it allows us to compare means of two data sets or sub-sets of a data.
In this section, first, some of the statistical concepts that are important and are a sort of prerequisite in understanding how inferences are drawn from the data are explained. This section has been named 'Important Statistical Concepts' and concepts under this section must be understood before exploring various Inferential Statistics. After that, certain Inferential Statistics such as Correlation, t-Tests, Analysis of Variance (under F Tests) and Chi-square are explained.
Regression has been deliberately left out from this section (even though it's a type of Inferential Statistic only) and has been placed under the section 'Modeling', as it can be better to understand how this inferential statistic is used as a modeling algorithm; however, one can read it as a part of Inferential Statistics only.

Before understanding the numerous statistics that can be used to draw inferences about the data, it is important to understand how we are able to draw inferences about the population from the sample in the first place. In this section, various concepts that allow us to either reject or accept a phenomenon are explored. Various terms such as p-value, significance level etc which will get repeated in all the below mentioned Inferential Statistics are discussed.
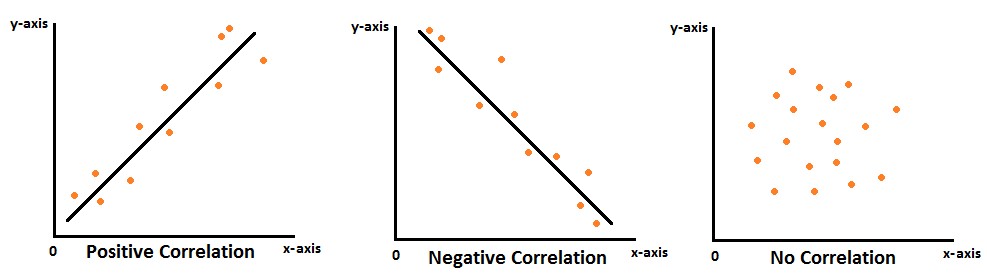
It is the most basic and simple inferential statistic but is also the most important statistic. Correlation Coefficients is used to find if the two numerical variables are related to each other or not. This concept plays an important role in Linear Regression. In this blog post mainly the Pearson's product-moment correlation coefficient is explained, along with brief mention of other correlation techniques.
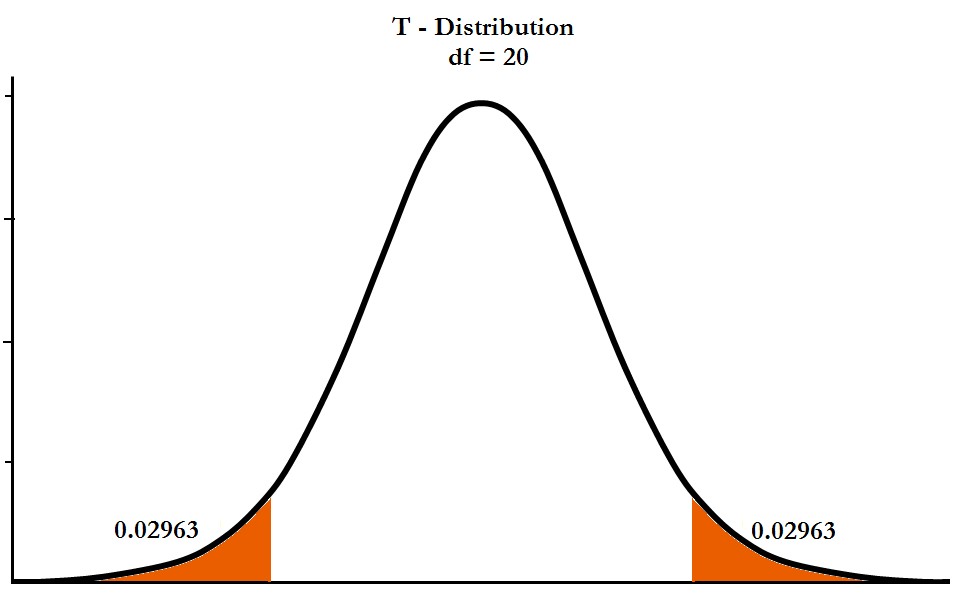
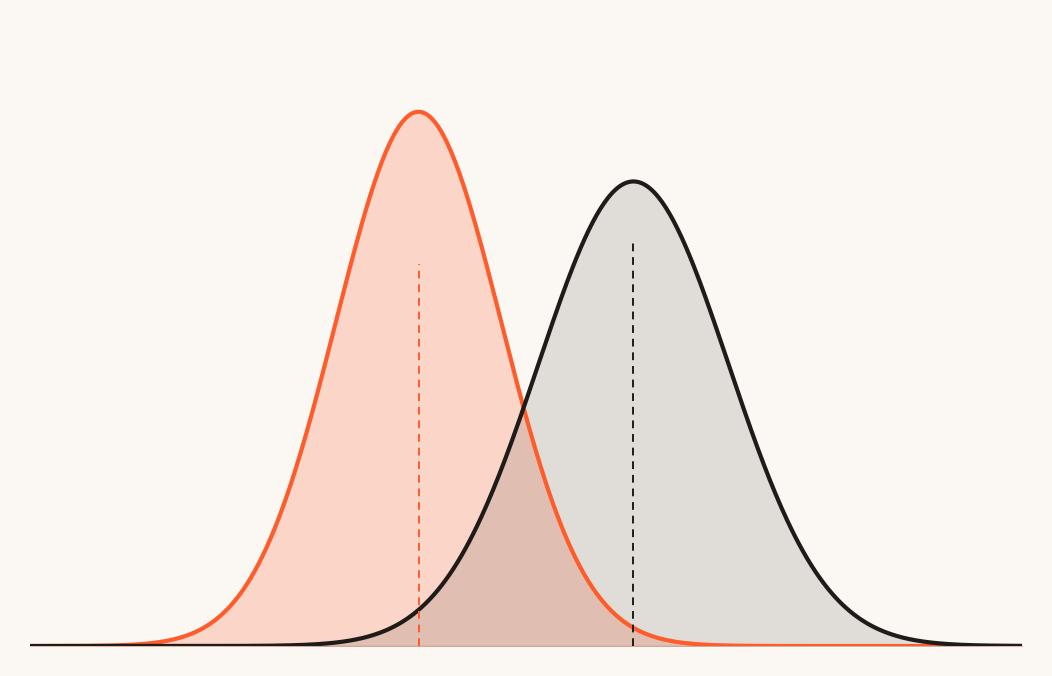
A hypothesis test that allows us to compare means and lets us draw the inference of the mean being different from each other or not. Various T-Tests allow us to compare means of two groups, means of the same group at different times, mean of a group against a hypothesized value etc. T-Tests are popularly used as they allow us to perform hypothesis testing even when the sample size is not large enough or the variance of the population is not known.
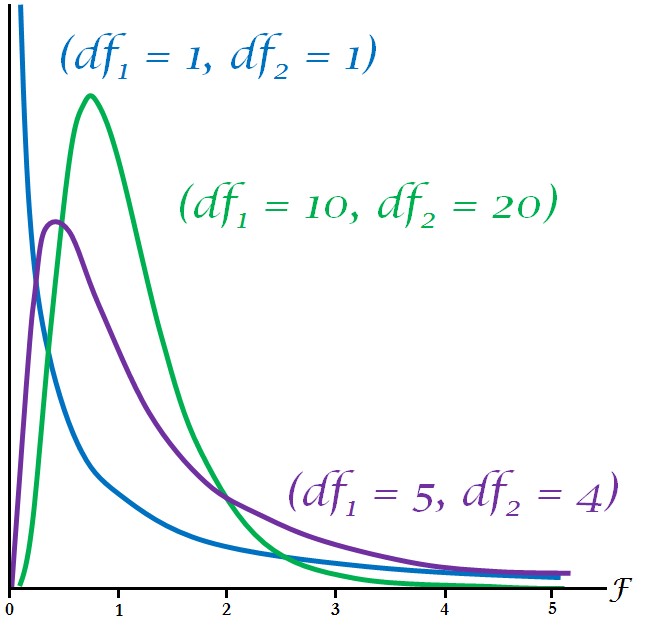
Another statistical test that can perform hypothesis testing by finding if the two datasets or variables are equal to each other or not by using the variance of these datasets. There are many statistical tests that can be termed as F-test as they have an F-distribution under the null hypothesis and F-ratios are calculated to reject or accept a hypothesis, but in this section the most famous F-test, Analysis of Variance (ANOVA), is explored.
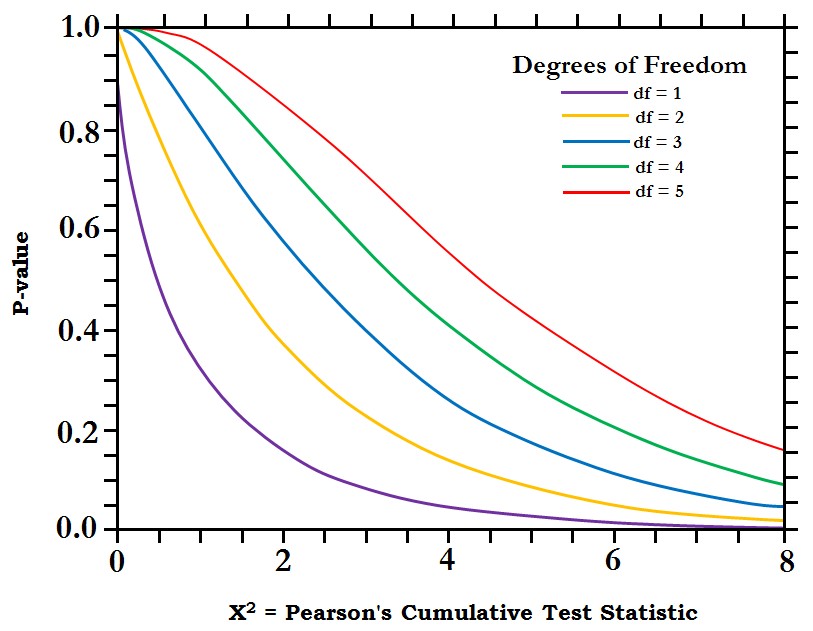
When it is required to compare two categorical variables, then a statistical hypothesis test is required which can perform such a task and this is what a chi-square test does. Chi-Square uses the frequency tables and the chi-square distribution to help us in rejecting or accepting the null hypothesis.