// important concepts
Standard Error, Standard Error of Mean and Central Limit Theorem
In this blog post, three statistical concepts are discussed that help us in explaining how various Inferential Statistics work. These are Standard Error, Standard Error of mean and the Central Limit Theorem. Below each one of them has been briefly discussed.
Standard Error
Standard Error means the deviation from the actual mean and in a way is similar to Standard Deviation as both are measures of spread with an important difference, that Standard Error is used as a measure to find the deviation between different means of sample and the mean of the population (actual mean) and thus it is a statistic whereas Standard Deviation is a parameter because data of the population is involved. So it is safe to say that the standard error is nothing but the standard deviation of the sampling distribution.
In terms of formula, Standard Error is what you see in the denominator when calculating various kind of Inferential Statistics. The reason why Standard Error is used as a denominator in various formulas of inferential statistics is that standard error tells us about the amount of variation that we can expect when we draw another sample of the same size from the population.
Standard Error of Mean
It is important to note that there are standard errors for all kind of statistics. Here we are mostly concerned with the Standard Error of mean. But first, there are some important terms to understand-
- Sampling Distribution of the Mean: if we take 200 random samples and compute mean of each sample then these 200 means would form a distribution which will be called Sampling Distribution of the Mean.
- Expected Value of the Mean: It is the mean of the above-mentioned distribution which is also considered as the population mean.
- Standard Error- The Standard Deviation of the Sample Distribution.
Standard Error of the mean refers to the average distance between the expected value which is the population mean and the mean of each individual sample. Standard Error of the mean helps us to understand that how much our expected mean is close to the actual population mean i.e. how much of the actual mean does my expected value represent.
Standard Error of the mean can be found out by dividing the population’s standard deviation or the sample estimate of the standard deviation (i.e. the standard deviation of a sample) with the square root of the sample size (for example the number of individuals in the sample).
Formula for Standard Error of Mean is-
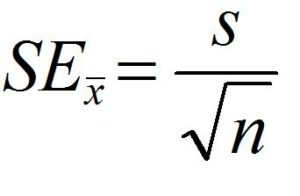
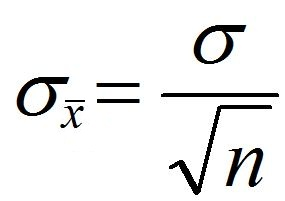
The above formula is to be used when the standard deviation of the population is not known. Here we use the standard deviation of the sample (Standard Error) and divide it by the square root of the total number of samples. However, when the standard deviation of the population is known, we use the below-mentioned formula where we use the standard deviation of the population and divide it by the square root of the total number of samples.
Difference between Standard Error and Standard Error of mean
If you are getting to know about all such terms for the first time then all such statistical jargons may confuse you, especially the terms like Standard Error and Standard Error of mean which sound very similar to each other.
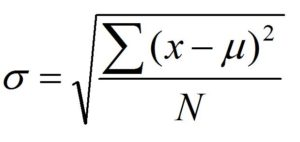
In simple words, Standard Error like Standard Deviation helps us to understand the spread or dispersion of our data in the sample distribution or the Sampling distribution of the mean. (Thus standard error is the standard deviation of the sampling distribution of a statistic). Standard Error is a statistical term that measures the accuracy with which a sample represents a population. In statistics, a sample mean deviates from the actual mean of a population; this deviation is the standard error. The term “standard error” is used to refer to the standard deviation of various sample statistics such as the mean or median. For example, the “standard error of the mean” refers to the standard deviation of the distribution of sample means taken from a population. The smaller the standard error, the more representative the sample will be of the overall population. Thus this Standard Error of mean tells us how far away we are from the actual population mean. You must note that the standard error of the mean (s/√n) is always smaller than the sample standard deviation (s). Also do not confuse between the terms- ‘Standard Deviation’, ‘Standard Error’, ‘Standard Deviation of Sample’ etc. Standard Deviation of an entire population is known as σ (Sigma) and is calculated using the square of the difference between each data point and the population mean, finding the sum of those values and then dividing that sum by the sample size, which is the variance and then taking the square root of the variance.
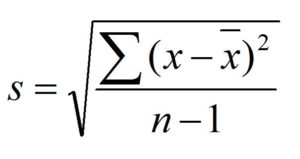
Whereas the ‘Standard Deviation of Sample’ (denoted “s”) has a very similar formula to the population standard deviation, the only difference being that the mean is calculated from the sample and, in the denominator, the sample size is reduced by 1 (N-1). Note that the sample standard deviation is not the same as the standard error: the standard error is the standard deviation of a sampling distribution (for the mean, SEM = s/√n).
Also remember that Standard Error of the mean is only a kind of Standard Error and for all kind of statistics such as for Correlations, T-Test, Regression etc there are types of different Standard Errors that are used in the denominator of their formulas.
Central Limit Theorem
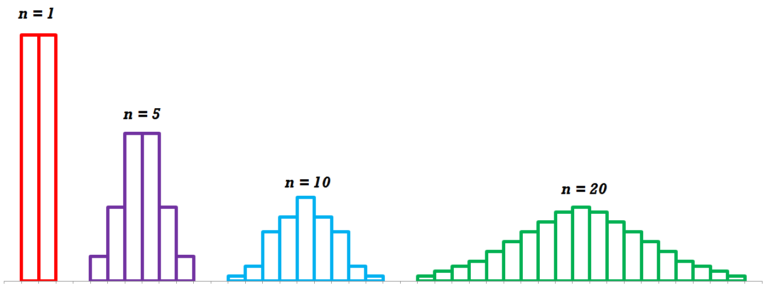
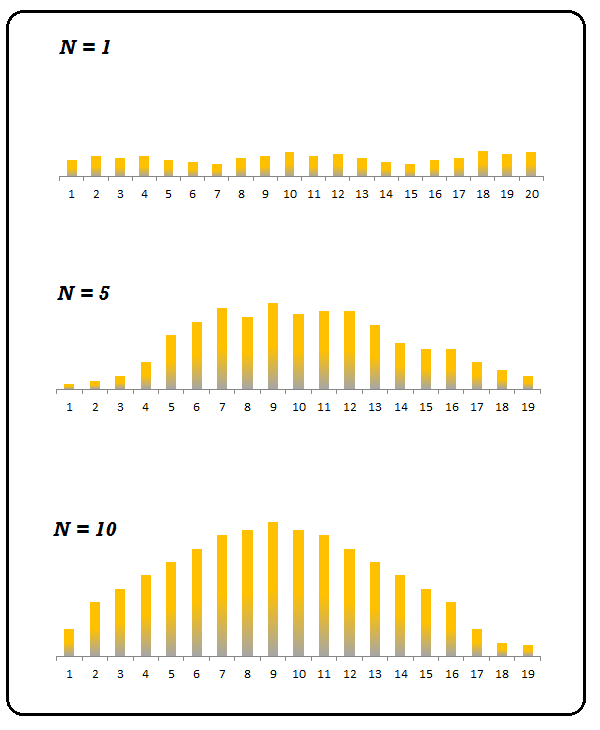
Now a question can be raised that why do we consider the mean of a sample distribution to be same as of the mean of the population from which it is drawn. This is presumed because of the Central Limit Theorem which states that if we plot mean of all the samples on a graph, then they will follow Normal Distribution regardless of how the distribution is of the actual population. It is the counter-intuitive aspect according to which even if the population is not normally distributed, the sample distribution will form a normal distribution.
Secondly, it states that the mean of all the sample means will converge or will be very close to the population mean. For example, we have 100,000 people in a city. We take 40 samples with each sample having 40 people to find the average income of the city and plot the mean of each of these samples. According to Central Limit Theorem, the distribution from such a data will be normal and the mean generated from such a distribution is roughly as same as the mean of the population (average Income of the people of this city).
Role of Sample Size
It is important to note that Central Limit Theorem is applicable as long as the sample size is large with the minimum sample size being at least of 30. This brings us back to the Standard error of mean where the sample size plays a major role as larger the sample size is, more accurate estimate the sample mean becomes of the parametric mean, therefore larger the sample, smaller the Standard Error. Also if the standard deviation in the sample is high, the greater will be the assumed variation of scores in the population and consequently larger will be the Standard Error of mean.
Sample Error thus is very important for Inferential statistics as some or the other type of Sample Error is used in Inferential Statistics such as in T-test, ANOVA, Regression etc. Sample Error is used as we observe the sample and want to draw conclusions and for drawing any conclusion we want to know that whatever we observe in the sample, how much of that phenomenon is represented in the larger population. As we have to guess the population mean for doing that, Sample Error comes into the picture. Also, Central Limit Theorem makes it possible to have our distribution in a normal shape which in turn helps us in drawing probabilities about the population from the sample which is something discussed in the next blog.