// inferential statistics · important concepts
There are certain statistical concepts that must be first understood for understanding the working of various inferential statistics. Below are the different blog posts that will work as the building blocks to understand why we are able to accept or reject a phenomenon.
Concepts such as Standard Error and the Central Limit Theorem make us understand how we are in a position to even try to draw an inference about the population from a sample. Z scores and Probability Distribution help us in understanding the various probabilities that are associated with a normal distribution. A quick glimpse of what a t-test is follows, which will help in understanding how probabilities can be found when the distribution is not normal. Hypothesis testing finally explains what a hypothesis is and what we mean by rejecting or accepting it.
The terms understood in the below posts are repeated in all kinds of inferential statistics and will also help us in understanding the output generated from different statistical models.
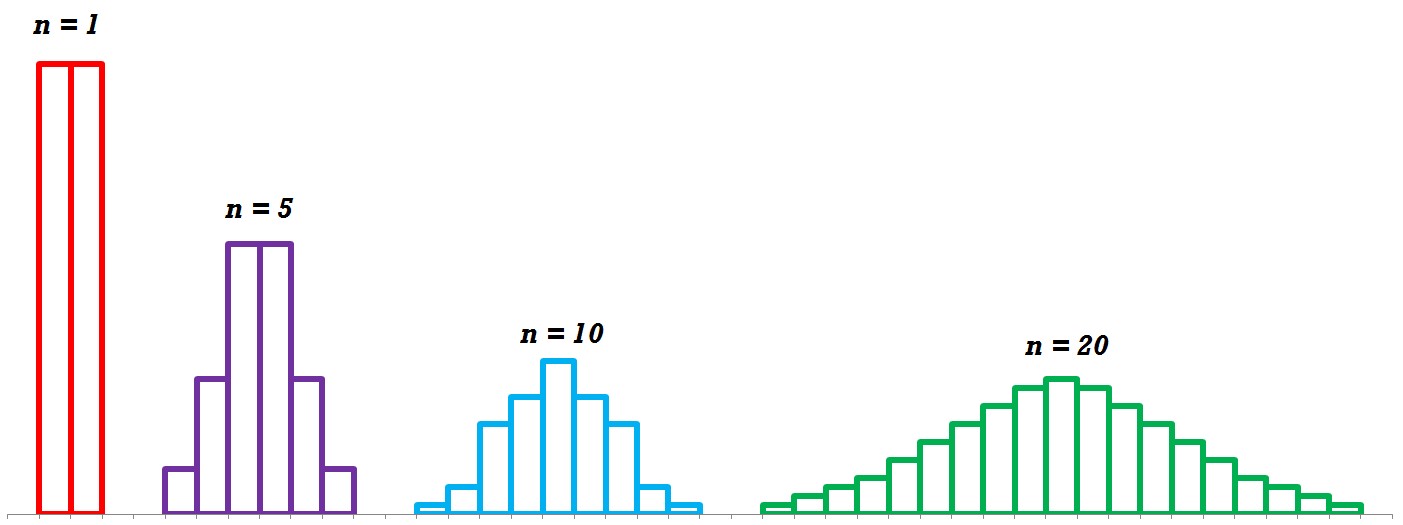
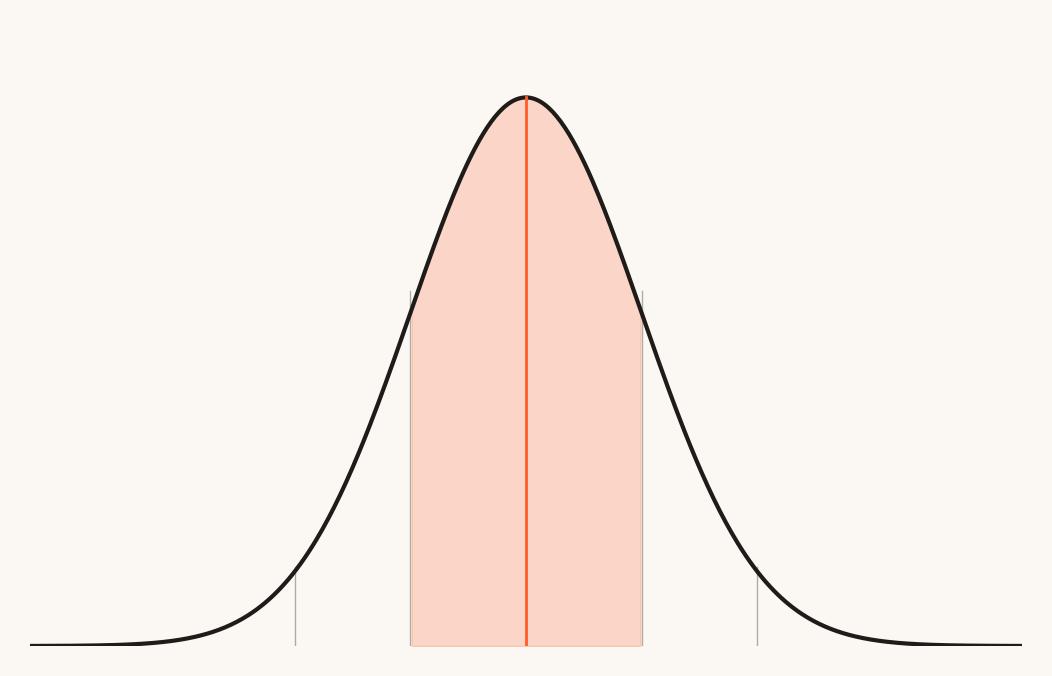
In this blog, certain concepts are explained such as standard error which is a measure of statistical accuracy, Standard Error of Mean which is used in formulas of various inferential statistics, and the Central Limit Theorem which is the cornerstone of Inferential Statistics.
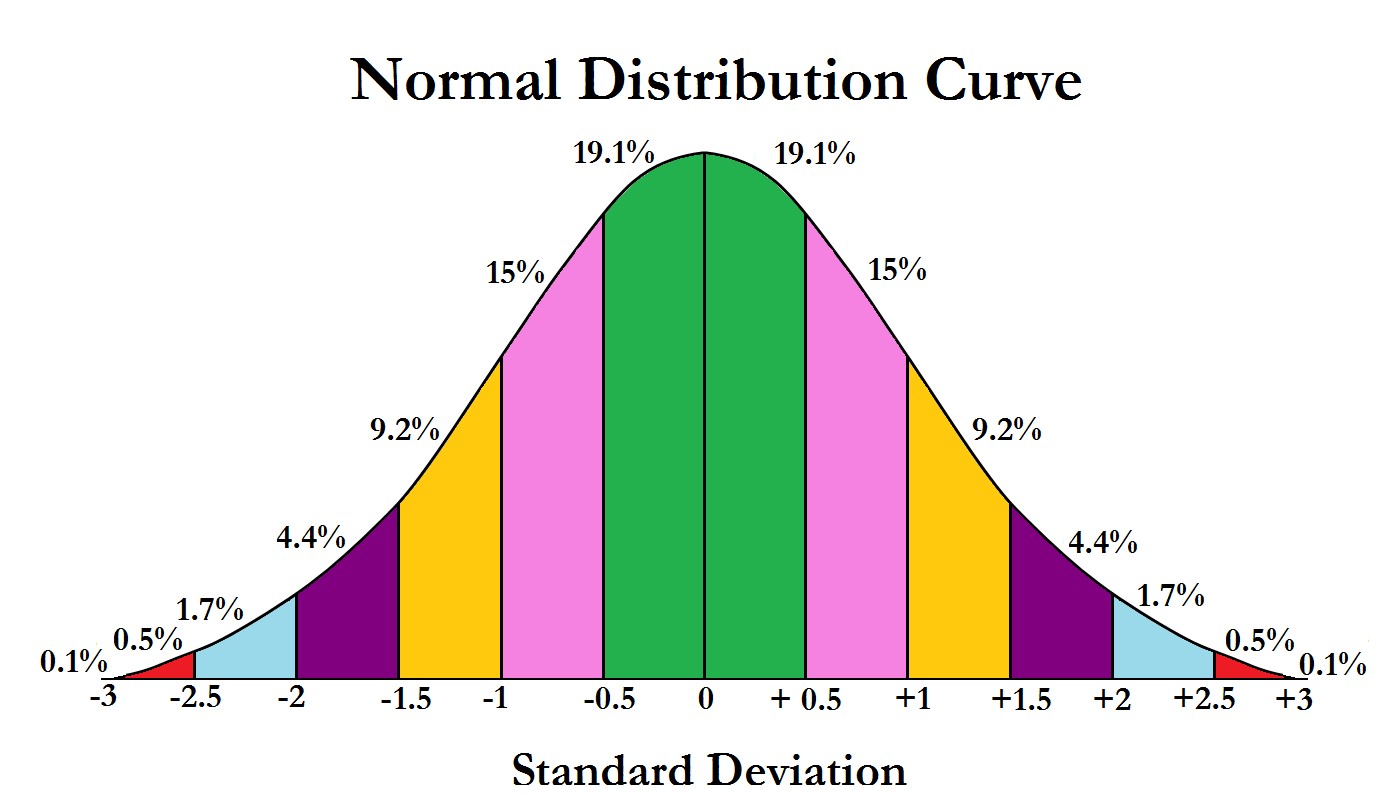
Concepts of Measures of Variability are used here for how variance can be used to draw inferences about the population data. The concepts of Measures of Shape also come into effect to see how probabilities are drawn based on the shape of the distribution.
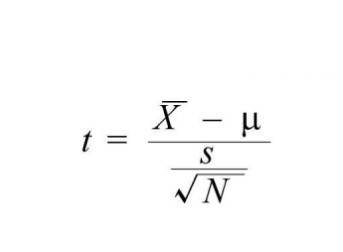
A quick intro to what a t-test is, how it is based on the t distribution and why it is important. Questions such as how a t-test is different from a Z Test are also discussed here.
Concepts such as what hypothesis testing is, what we mean by p-value, confidence level, significance level, the type I and type II error, null and alternative hypothesis, and one-tailed and two-tailed hypothesis are explored in the blog post.