// time series
Introduction to Time Series Data
Data can be used for forecasting values when a time component is involved in it. In this blog, we explore the various kinds of data that can be used for forecasting values over a period of time and the various components of this kind of data.
There are broadly two kinds of data that we deal with when performing time series - Time Series Data and Panel Data, aka Hierarchical Time Series Data. But before that, we first understand Cross-Sectional Data, which is the kind of data that we have been using up until now.
Types of Data
Cross-Sectional Data
In such data, the time period is fixed. For example, if we are performing Linear or Logistic Regression on data which has the customer transaction details of the last two years, then such data is called Cross-Sectional Data.
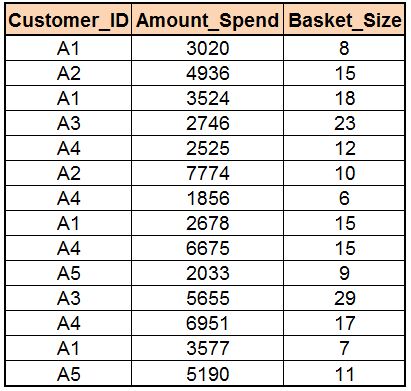
Here we can calculate different metrics such as customer spend of the last two years, customer visits of the last three years, average customer transaction value of the last three years. Here the time remains fixed; therefore we calculate different metrics across customers.
However, there are other kinds of data that can be used for forecasting values, such as Time Series and Panel Data.
Time Series Data
Here the object - which in our example is the customer - stays fixed. For example, Customer A1 remains fixed and we have a time component along with other features.
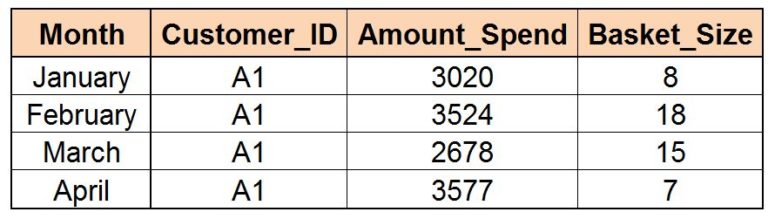
If such data is compared to Cross-Sectional Data, then we can easily understand the difference between them: where in Cross-Sectional Data the time component remained fixed and the customers varied, here in Time Series Data the customer is the same but the time component is varying. Therefore, for the same customer, we have different data across time.
Time series data comes particularly in handy when the time period is divided into continuous, equal intervals. For example, if we have data for January, February and then for November and December, then such data cannot be used. Data also cannot be used when it has missing periods - for example, if we have month-wise data for a year with the data for the sixth month missing, then such data is not of great use. Thus the data should also be equally spaced, i.e. if we have data till the fourth month but after that we have weekly data, then such data can't be reconciled.
Panel Data
Also known as Hierarchical Time Series Data, this is a combination of Cross-Sectional and Time Series data. For example, if we have customer transaction data for the last three years for multiple customers, then such data can be called Panel Data.
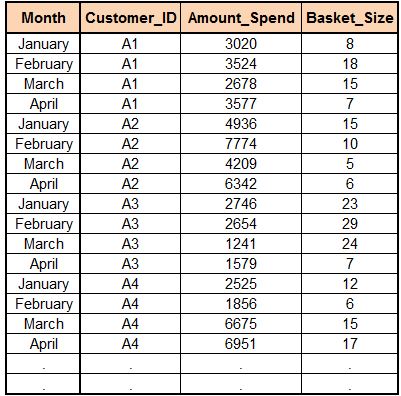
Panel data has the same preconditions which Time Series data has for being of any use.
Usage of Time Series / Panel Data
Such types of data are used for short and medium-term regular business problems, such as forecasting stock prices and forecasting demand to plan inventory. They are also used for econometric modeling, which means forecasting long-term values, such as forecasting GDP, where we have to deal with a lot of economic factors such as population, income, prices, other global factors, etc.
Short, Medium and Long-term
We can divide forecasting into short, medium and long-term.
Short Term: Scheduling personnel, production, transportation, forecasting demands as a part of the scheduling process.
Medium Term: Determine future resource requirements for the purchase of raw material, hiring personnel, buying machinery and equipment.
Long Term: Strategic planning, taking account of opportunities, environmental factors and internal resources.
Examples
Below are a few examples where such data is regularly used.
Example 1: Weather forecasting or bullion forecasting, which comes under short-term forecasting.
Example 2: Stock price forecasting, which cannot be long-term, as forecasting is done for coming days or weeks, or at maximum, months.
Example 3: An automobile manufacturer has to buy various components from different sellers. Thus it has to forecast demand for car sales and maintain inventory accordingly. This is medium-term forecasting.
Example 4: Cash management (cash optimization) - for example, assessing the amount of money to be kept in each ATM. If more money is kept than required, then the money will go unutilized and will be unproductive, causing loss to the bank. If less money is kept than what is required, then the ATM will soon run out of money, which will lead to customer dissatisfaction and will also cause a loss to the bank in the long run.
Example 5: Forecasting workforce (workforce planning). This is short-to-medium-term forecasting. For example, in a customer support centre, the customer calls are different on different days and at different times of the day (day and night). If we have 50 employees, then it becomes important to manage the employees. Here the call volume (demand) is forecasted, which helps in the management of employees (optimization).
Example 6: Service industries may require planning in the recruitment process, as if they forecast projects coming their way, they can start the recruitment process accordingly.
Example 7: GDP growth of a country. This comes under long-term forecasting.
Components of Time Series Data
The components found in Time Series data are the same as those found in Panel Data; however, understanding these components in Time Series data is relatively easy.
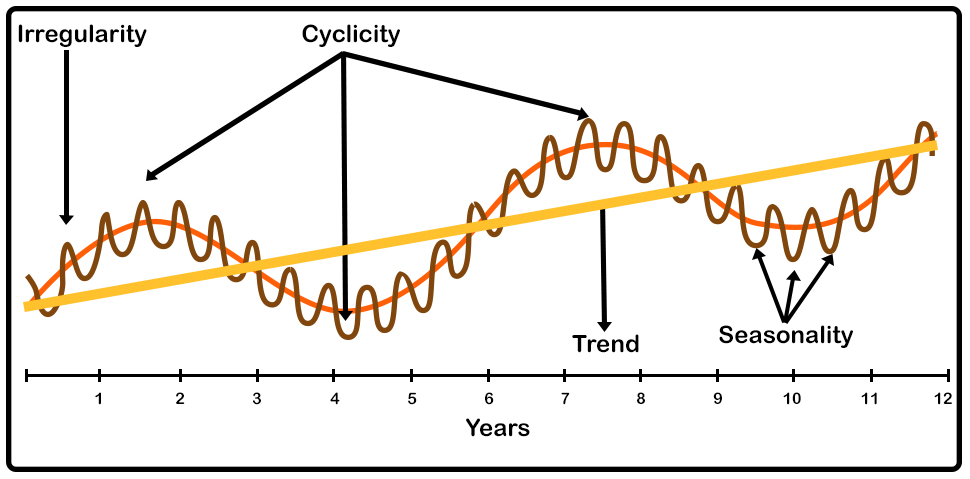
There are four main components of time series data: Trend, Seasonality, Cyclicity and Irregularity.
Trend
Trend means that the data might have fluctuations, but on an overall level there is an increasing/decreasing trend. Below, the orange line represents the trend line, which we get when we remove the seasonality component.
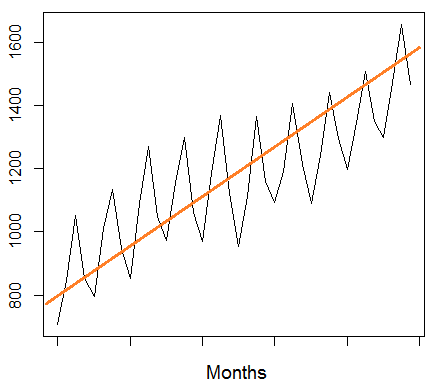
Seasonality
Seasonality means a pattern. For example, every April there is a slump in sales, or there is a jump in call volume every Saturday and Sunday, or a sudden increase in demand for electricity in summers at 5-6 p.m. Below we can see that when we remove the trend component from the above figure, we get a clear understanding of seasonality.
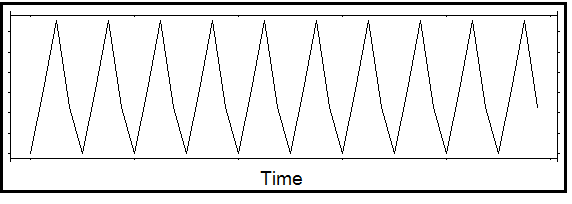
There are two types of seasonality:
- Within a day or week, i.e. comparison between day or week.
- Within a year - peak/slump at specific time periods of the year.
Cyclicity
Cyclicity is found in data over a lot of years. For example, high sales every fourth year due to an event (a spike in the sales of televisions due to the football World Cup). Another example can be a decrease in projects every four years (elections causing apprehensions about new government policies).
Irregularity
Irregularity is when the data has no trend, seasonality or cyclicity.
These four components play an important role in forecasting values when using Smoothing and ARIMA techniques. With the understanding of the type of data and the components of time series data, we can proceed with exploring the various techniques that can be used for forecasting.