// important concepts
Brief Intro to T Test
In the previous few blog posts, it was explored how probabilities can be calculated by using the area under the curve with the help of z-value. However the fundamental principle that lies below all this is that the distribution should be normal as when the distribution is normal, we know about the area that each point covers in the distribution. When we draw a lot of samples, we apply the Central Limit theorem which states that if the sample size is large enough (more than 30), it will follow a normal distribution. Also in all such cases, the standard deviation of the population is known to us. To find the area under the curve (or probability) we use the Standard Normal Distribution Table or the z-score table and the z-score to find the probabilities associated with the normal distribution.
The problem arises when we don’t have a sample large enough that a central limit theorem can be applied or if only the mean of the population is available and no standard deviation is provided then in such a scenario we will have to estimate the standard deviation of the population from the standard deviation of our sample only. Therefore under such circumstances, the Z-test, Z value, Z Table, all will become useless. This is where the T-Test aka Student’s T-Test comes into play which has its separate formula to calculate t score which is parallel to z score/value and has a T-Table which is like a Z Table only with an additional column of Degrees of Freedom which for now, for convenience can be explained as the sample size minus 1 (N-1). And by using T Score and T Table, we can perform various T Tests as explained in detail in the blog t-Tests.
T-Distribution
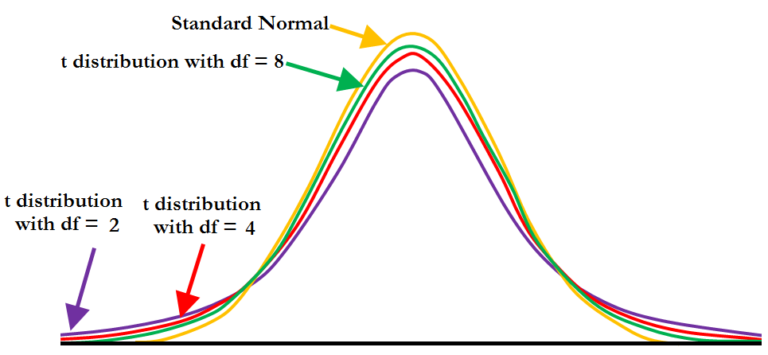
First things first- The Z test is applicable on a Normal Distribution which has certain particular characteristics, the T-Test is applicable on T-Distribution which also has certain characteristics. Let’s first understand the characteristic of T-Distribution and the reasons for it. The T Distribution is virtually identical to the normal distribution but as the sample size decreases, it becomes flatter in the middle and higher on the ends. We use the degrees of freedom in the table to calculate the probabilities, we consider this sample size or degrees of freedom because as there is a decrease in the sample size, the probability associated with it changes. Therefore when the sample size decreases, the distribution starts to deviate from the normal and the t-distribution is used as it almost follows the same Normal Distribution but with some necessary variations.
Formula for T score
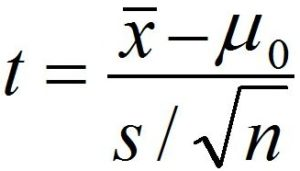
The formula for calculating t-score is similar to z-score with the difference being in the denominator where in place of standard deviation, we use the Standard Error of Mean (where we divide the standard deviation of the sample (standard error) with the square root of the total number of samples).
Difference between z and t-score
Which score should be calculated? This is a question that can often be very confusing.
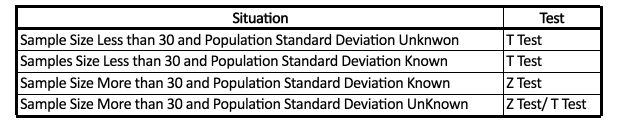
There can be generally two ways to solve this problem. Firstly if the sample size is less than 30 then only T-tests should be conducted, also if the sample size is less than 30 and standard deviation of the population is not known, then also, conducting a t-Test is the right thing to do. If the sample size is more than 30 and standard deviation of the population is known then z-scores should be calculated (i.e. z-Test should be conducted), however if the population is large enough and standard deviation of the population is unknown then any of the two tests can be conducted because as the sample size increases, the difference in the probabilities calculated from both these tests decreases.
 Z Test" />
There are various kinds of T-Test and each of them are explored in a separate blog post.